What Is a Psychrometric Chart and When to Use It
A psychrometric chart is a graphical tool that shows the relationships among air temperature, moisture content, and relative humidity.
It is used to understand how air behaves when it is heated, cooled, humidified, or dehumidified.
Rather than looking at temperature or humidity alone, a psychrometric chart shows how these properties change together.
Key takeaway: A psychrometric chart shows how temperature and moisture interact in real air.
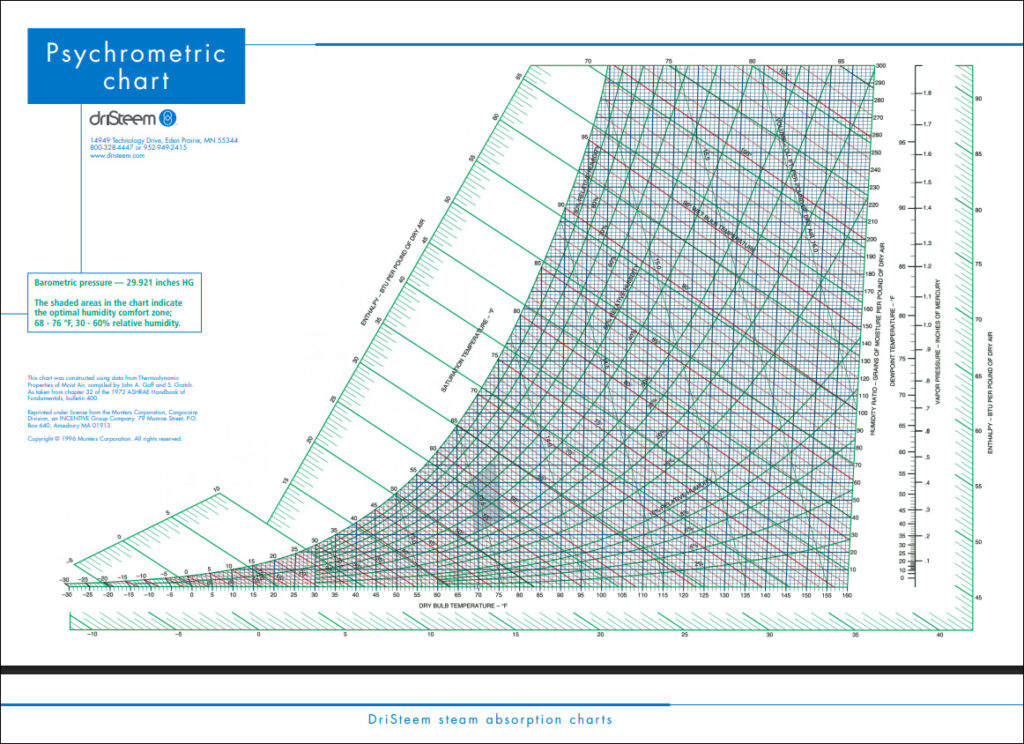
Download your free psychrometric chart (PDF) to understand air temperature and moisture relationships
What Information a Psychrometric Chart Shows
A psychrometric chart combines several air properties into one visual reference, including:
- Dry‑bulb temperature (air temperature)
- Relative humidity (RH)
- Moisture content
- Dew point
- Enthalpy (heat content)
You do not need to memorize every line on the chart to use it effectively. At its core, the chart helps explain what happens to air when conditions change.
Key takeaway: The chart brings multiple air properties together, so changes can be understood at a glance.
Why Psychrometric Charts Are Used in Humidity Control
Humidity control decisions involve more than choosing a humidifier or setting a target RH. They require understanding how:
- Heating air lowers relative humidity
- Cooling air raises relative humidity
- Moisture addition or removal affects condensation risk
A psychrometric chart makes these relationships visible, helping designers and operators predict outcomes rather than react to problems after they occur.
Key takeaway: Psychrometric charts help prevent moisture problems by showing cause-and-effect relationships.
When You Should Use a Psychrometric Chart
A psychrometric chart is especially useful when:
- Evaluating humidity problems
- Designing humidification or dehumidification systems
- Estimating humidity loads
- Assessing condensation risk
- Reviewing outdoor air impacts
It is commonly used during system design, troubleshooting, and performance evaluation.
Key takeaway: Use a psychrometric chart when temperature and moisture decisions affect system performance or risk.
When You Don’t Need a Psychrometric Chart
Not every situation requires a chart. Day‑to‑day operation often relies on:
- Setpoints
- Controls
- Sensors and automation
However, when conditions change, complaints arise, or systems underperform, the chart provides context that numbers alone cannot.
Key takeaway: You may not use a psychrometric chart every day, but it is invaluable when things go wrong.
A Simple Way to Think About It
Think of the psychrometric chart as a map:
- Each point on the map represents a specific air condition
- Moving on the map shows what happens when air is heated, cooled, humidified, or dried
Instead of guessing, the chart shows where the air is now and where it will go next.
Key takeaway: The psychrometric chart visually maps air behavior, not just readings.
Why Psychrometric Charts Matter for Engineers and Facility Teams
For engineers, the chart supports:
- Accurate system design
- Load calculations
- Condensation control strategies
For facility teams, it helps explain:
- Why humidity problems occur
- Why changing temperature affects RH
- Why moisture issues are seasonal
Both audiences benefit from understanding how air responds to change.
Key takeaway: Psychrometric charts connect theory to real‑world building behavior.
Related Topics
- Humidity Control Fundamentals
- What Is Relative Humidity (RH)?
- Humidity vs Relative Humidity: What’s the Difference?
- What Is Dew Point and Why Does It Matter
- How Temperature Changes Relative Humidity
Connect with a humidity control expert
Next Steps
Contact your local DriSteem representative to learn more about humidity control. Use the Find a Rep tool below to find your nearest representative.